|

|
MIAMI-DADE COUNTY
PUBLIC
SCHOOLS
Miami,
Florida
|
M-DCPS Student
Membership
February 1999
|
|
Miami-Dade County Public Schools is a countywide school
system and it is the fourth largest system in the
nation.
Management of the schools is totally independent of
metropolitan and city governments. The metropolitan
government collects the school tax for the school system but
exercises no control over its use.
The nine-member School Board is elected by single member
districts. Regular, open meetings are generally held in the
Board auditorium one Wednesday of each month at one
o'clock.
Responsibility for administration of the schools is vested
in the District Superintendent, appointed by the Board. The
school district is divided into six regions, each with a
region superintendent and administrative staff.
|
|
GENERAL
INFORMATION - TEN-YEAR TRENDS
|
Year
|
Schools
|
Pupils
|
Teachers
|
Salary*
|
1989-90
1990-91
1991-92
1992-93
1993-94
1994-95
1995-96
1996-97
1997-98
1998-99
|
263
271
278
279
284
286
290
300
302
309
|
281,403
292,411
304,287
302,163
312,300
321,955
333,444
340,904
345,861
352,595
|
15,454
16,122
16,051
15,240
15,540
16,885
17,094
17,410
17,687
18,166
|
35,060
37,794
36,995
36,853
36,947
39,299
40,255
41,002
42,308
42,015
|
* Average teacher's salary excluding fringe benefits
(Salary for ten months).
STUDENT MEMBERSHIP BY
GRADE LEVEL, 1998-99
|
Grade
|
White
Non-Hispanic
|
Black
Non-Hispanic
|
Hispanic
|
Other**
|
Total
|
|
PK*
K
1
2
3
4
5
6
7
8
9
10
11
12
|
644
2,961
3,236
3,286
3,514
3,486
3,472
3,388
3,483
3,378
3,948
3,572
2,897
2,614
|
4,241
8,236
8,752
9,203
8,986
8,937
8,809
9,226
9,241
8,688
11,092
9,038
6,581
5,167
|
4,272
13,827
14,741
15,153
15,807
15,289
14,765
14,846
14,398
13,856
17,041
14,010
10,017
8,216
|
153
591
641
666
539
492
472
440
392
370
464
405
337
319
|
9,310
25,615
27,370
28,308
28,846
28,204
27,518
27,900
27,514
26,292
32,545
27,025
19,832
16,316
|
|
TOTAL
|
43,879
|
116,197
|
186,238
|
6,281
|
352,595
|
|
TOTAL MALE
TOTAL FEMALE
|
|
|
180,944
171,651
|
* PK total includes 7,495 students in specially funded
programs (e.g., State Intervention, Chapter 1,
Headstart).
** Other includes American Indian, Asian, and Multiracial
categories.
Source: Student Data Base System, October 1998
|
ETHNIC COMPOSITION OF STUDENTS
BY BOARD MEMBER DISTRICT
OCTOBER 1998
|
District
|
White
Non-Hispanic
|
Black
Non-Hispanic
|
Hispanic
|
Other*
|
Total
|
|
I
II
III
IV
V
VI
VII
VIII
IX
Other**
|
1,070
1,299
5,963
2,846
2,047
4,961
9,627
4,826
10,387
853
|
35,476
36,143
6,907
4,985
2,118
3,877
6,387
1,157
14,399
4,748
|
7,521
10,469
9,737
37,347
23,441
20,042
25,794
30,894
16,728
4,265
|
459
389
757
565
310
524
1,479
554
1,164
70
|
44,526
48,300
23,374
45,743
27,916
29,404
43,287
37,431
42,678
9,936
|
|
TOTAL
|
43,879
|
116,197
|
186,238
|
6,271
|
352,595
|
|
PERCENT
|
12.4%
|
33.0%
|
52.8%
|
1.8%
|
100%
|
* Includes American Indian, Asian, and multiracial
categories.
** Includes vocational/technical education centers, charter
schools, alternative/specialized centers and the Educational
Alternative Outreach Program centers.
|
PK-12 SCHOOL CENTERS
BY BOARD MEMBER DISTRICT*
1998-99
|
District
|
Elem.
|
Middle
|
Senior
High
|
Alternative/
Specialized**
|
Total
|
|
I
II
III
IV
V
VI
VII
VIII
IX
|
33
32
11
18
17
17
25
21
27
|
6
8
3
6
4
4
7
6
7
|
4
5
3
4
1
5
3
4
3
|
7
1
—
3
1
5
6
—
2
|
50
46
17
31
23
31
41
31
39
|
|
TOTAL
|
201
|
51
|
32
|
25
|
309
|
* Does not include vocational/technical education centers
and the Educational Alternative Outreach Program
centers.
** Includes Charter schools, alternative and ESE
centers.
|
|
SUMMER SCHOOL
MEMBERSHIP
FIVE-YEAR TRENDS*
|
Year
|
Elementary
|
Middle
|
Senior
|
Total
|
|
1994
1995
1996
1997
1998
|
82,479
69,736
71,891
55,931
52,110
|
37,361
33,131
33,034
27,753
27,736
|
43,874
35,483
40,472
42,706
44,979
|
163,714
138,350
145,397
126,390
124,825
|
* End of summer school count.
Source: Division of Attendance
|
ENROLLMENT IN BILINGUAL
PROGRAMS, 1998-99
|
Program
|
Enrollment
|
|
English for Speakers of Other Languages
Spanish for Spanish Speakers
Elementary Spanish as Second Language
Secondary Spanish as a Foreign Language
Basic Skills in the Home Language
|
46,384
99,437
48,628
16,277
39,021
|
Source: Computation by the Office of Educational Planning
based on data in the Student Data Base System.
|
ENROLLMENT IN MAGNET PROGRAMS, 1998-99*
|
Program
|
Number of Schools
|
Enrollment
|
|
Careers & Professions
Communication/Humanities
Gifted
International Education
Math/Science & Technology
Montessori
Visual & Performing Arts
|
18
4
7
11
10
4
17
|
(Sr. High)
(2 Elementary, 2 Middle)
(Elementary)
(5 Elementary, 3 Middle, 3 Sr. High)
(4 Elementary, 4 Middle, 2 Sr. High)
(Elementary)
(5 Elementary, 7 Middle, 5 Sr. High)
|
6,699
1,703
660
5,347
2,313
985
5,582
|
|
TOTAL
|
71
|
|
23,289
|
* In addition to the magnet schools, there are 14
"Controlled Choice" schools serving 9,256 students; 7
Charter schools serving 755 students; and 4 Satellite
Learning Centers serving 507 students.
STUDENTS SERVED IN
EXCEPTIONAL STUDENT
EDUCATION PROGRAMS, 1998-99*
|
Program
|
Enrollment*
|
|
Mentally Handicapped
Trainable Mentally Handicapped
Physically Handicapped & Occupational
Therapy
Speech/Language/Hearing Impaired
Visually Handicapped
Emotionally Handicapped
Specific Learning Disabilities
Gifted**
Profoundly Handicapped
Hospital/Homebound
|
2,913
1,181
869
5,214
134
3,420
20,167
20,453
220
3,337
|
|
TOTAL
|
57,908
|
* Unduplicated membership (October 1998 "Survey 2" data
as of January 13, 1999). Total ESE enrollment, per Survey 9
collected in December was 57,689.
Source: Florida Department of Education, Survey 2 (10/98) as
of 1/13/99
|
|
ENROLLMENT IN ADVANCED
LEVEL COURSES
1998-99
|
Enrollment in Honors Courses & Dual
Enrollment
Enrollment in Advanced Placement Courses
|
97,922
12,585
|
|
TOTAL
|
110,507
|
|
ENROLLMENT IN VOCATIONAL COURSES
1998-99
|
Total Enrollment in Grades 6-8
Exceptional Student Enrollment
Enrollment in Grades 9-12:
|
|
Agribusiness
Business Technology Education
Diversified Education
Health Science Occupations
Family & Consumer Services
Technology Education
Industrial Education
Marketing
Public Service Education
|
882
20,523
8,436
3,995
9,385
9,055
8,430
1,793
2,401
|
Total Enrollment in Grades 9-12
|
26,996
5,749
64,900
|
|
TOTAL ENROLLMENT
|
97,645
|
|
HIGH SCHOOL AND ADULT-VOCATIONAL
SCHOOL ENROLLMENT 1998-99
|
School/Center
|
High
School*
|
Adult
Vocational**
|
|
Academy for Community Education
American Senior/Adult Education Center
Baker, George T. Aviation School
Braddock, G. Holmes Senior
C.O.P.E. Center North
Coral Gables Senior/Adult Education Center
Coral Reef Senior
Design & Architecture Senior
Dorsey, D.A. Skill Center
English Center
Fienberg/Fisher Adult Education Center
Goleman, Barbara Senior
Hialeah Senior/Adult Education Center
Hialeah-Miami Lakes Senior/Adult Ed Center
Homestead Senior
Krop, Dr. Michael Senior
Lindsey Hopkins Technical Education Ctr
Maritime & Science Technology Academy
M-DCPS Corporate Academy North
M-DCPS Corporate Academy South
Miami Beach Senior/Adult Education Center
Miami Carol City Senior/Adult Ed Center
Miami Central Senior
Miami Coral Park Senior/Adult Ed Center
Miami Edison Senior
Miami Jackson Senior/Adult Education Ctr
Miami Killian Senior
Miami Lakes Technical Education Center
Miami Douglas MacArthur North
Miami Douglas MacArthur South
Miami Norland Senior
Miami Northwestern Senior/Adult Ed Center
Miami Palmetto Senior/Adult Ed Center
Miami Senior/Adult Education Center
Miami Skill Center
Miami Southridge Senior/Adult Ed Center
Miami Springs Senior/Adult Education Ctr
Miami Sunset Senior/Adult Education Center
Morgan, Robert Vocational Technical
New World School of the Arts
North Miami Senior/Adult Education Center
North Miami Beach Senior
School for Advanced Studies North
School for Advanced Studies South
South Dade Senior/Adult Education Center
South Dade Skill Center
South Miami Senior
Southwest Miami Senior/Adult Ed Center
William H. Turner Tech.
UM/Knight Center for Applied Technology
Wallace, D. C.O.P.E. Center South
|
156
2,786
-
5,207
251
3,401
2,199
471
16
-
-
4,204
3,206
2,790
2,667
1,475
19
550
165
92
2,647
2,728
3,013
4,008
2,251
2,790
3,435
-
251
247
2,354
2,915
3,100
3,269
15
3,970
3,388
4,430
180
469
3,418
3,031
75
194
2,237
-
2,616
3,158
2,119
149
225
|
-
3,238
864
-
-
2,198
-
-
1,528
6,178
2,019
-
5,486
4,901
-
-
4,668
-
-
-
2,804
1,648
-
4,131
-
4,139
-
2,563
-
-
-
2,441
3,248
3,568
2,624
2,043
2,217
4,924
2,047
-
6,047
-
-
-
2,044
641
-
2,267
1,725
-
-
|
|
TOTAL
|
92,337
|
82,201
|
* October 1998 Membership
** Unduplicated enrollment during the first trimester.
Sources: High School: Student Data Base System
Sources: Adult/Vocational:
Office of Applied Technology, Adult, & Career Ed.
|
GRADUATES
|
|
1993-94
|
1994-95
|
1995-96
|
1996-97
|
1997-98
|
|
High School*
Adult School
GED
|
14,557
957
4,114
|
14,538
1,084
4,020
|
14,246
1,148
3,136
|
13,751
804
3,394
|
13,738
781
3,254
|
* Includes regular and exceptional student diplomas, but
excludes Certificates of Completion
Sources: High School: Student Data Base System, October
1998
Sources: Adult School &
GED: Office of Applied Technology, Adult, & Career
Education
|
MIAMI-DADE COUNTY PUBLIC SCHOOLS
BOARD MEMBER DISTRICTS & SENIOR HIGH SCHOOLS
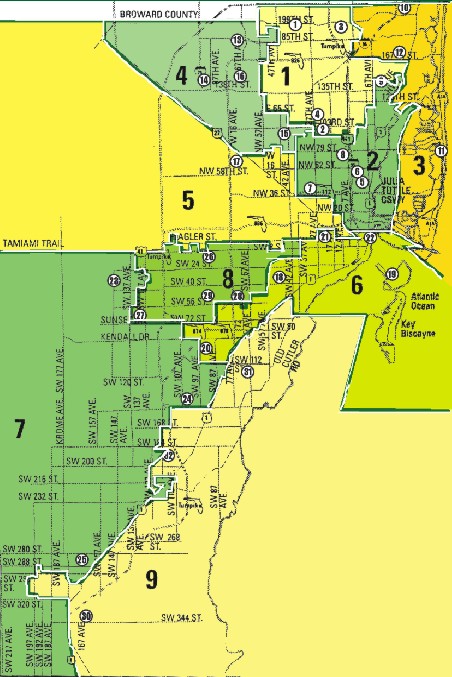
For a larger picture of the map, click
here.
|
ANNUAL BUDGET, ALL FUNDS - 1998-99
(in millions of dollars)
|
REVENUE
|
|
Federal
State
Local
|
$ 234.5
1,564.3
961.3
|
8.5%
56.7%
34.8%
|
|
Total Revenue
Non-Revenue Sources
Beginning Balances/Encumbrances
|
$2,760.1
69.9
624.2
|
100.0%
|
|
Total Revenues and Balances
|
$3,454.2
|
|
|
APPROPRIATIONS
General Fund
Instructional Services
Instructional Support
Board of Education
General Administration
School Administration
Facilities Acquisition & Construction
Fiscal Services
Central Services
Transportation Services
Operation of Plant
Maintenance of Plant
Community Services
|
$1,37 6.1
183.8
4.2
6.7
120.8
.6
13.4
69.8
69.0
164.7
112.8
22.8
|
64.5%
8.6%
0.2%
0.3%
5.6%
—%
0.6%
3.3%
2.8%
7.7%
5.3%
1.1%
|
|
TOTAL
|
$ 2,134.7
|
100.0%
|
|
Special Revenue
Funds
|
|
(Instruction and
Support Services $140.8; Food Services
$110.9)
|
Debt Service
Fund
|
|
(Redemption of
Principal $60.5; Interest, Dues and Fees
$74.6)
|
Capital Project
Funds
|
|
(Land, Buildings, and
Equipment $ 631.0; Remodeling
$149.9)
|
Trust and Agency
Funds
|
|
(Early Retirement $2.7;
Special Events $.6; Financial Aid $.5; Law
Enforcement $.1)
|
|
$ 251.7
$ 135.1
$ 780.9
$ 3.9
|
|
|
Total Appropriations
|
$3,306.3
|
|
|
Ending
Balance/Reserves
|
|
General Fund $44.4;
Food Service $5.5; Debt Service Fund
$59.6; Capital Projects Funds $6.1; Early
Retirement Fund $32.3)
|
|
$ 147.9
|
|
|
Total Appropriations & Balances
|
$3,454.2
|
|
Source: Office of Budget Management

|
TAXABLE PROPERTY, MILLAGE & REVENUE
1994-95 TO 1998-99
(Operating Budget)
|
Year
|
Assessed Value Taxable Property
|
Operating* Millage
|
Revenue
|
|
1994-95
1995-96
1996-97
1997-98
1998-99
|
$71,189,244,525
74,623,600,854
78,569,371,870
82,319,881,712
86,909,908,907
|
7.503
7.373
7.356
7.360
7.182
|
$ 507,426,257
522,689,819
549,058,485
575,580,613
592,977,617
|
* In addition to the operating millage shown, capital
improvement and debt service millages were levied as
follows:
|
|
Capital Levy
|
Debt Service Levy
|
|
Year
|
Millage
|
Revenue
|
Millage
|
Revenue
|
|
1994-95
1995-96
1996-97
1997-98
1998-99
|
2.000
2.000
2.000
1.996
2.000
|
$135,259,565
141,784,842
149,281,807
156,094,960
165,128,827
|
0.842
1.016
1.010
1.106
0.978
|
$56,944,276
72,026,700
75,387,312
86,493,500
80,747,996
|
Source: Office of Budget Management
COMPARATIVE
STATISTICS
(twenty largest U.S. school districts)
1997-98
|
District
|
K-12 Membership Fall
1997
|
Cost Per
Pupil*
|
Teacher/ Pupil
Ratio**
|
|
New York, NY
Los Angeles, CA
Chicago, IL
MIAMI-DADE COUNTY, FL
Broward County, FL
Houston, TX
Philadelphia, PA
Clark County, NV
Hawaii, State of
Detroit, MI
Dallas, TX
Hillsborough County, FL
Fairfax County, VA
Palm Beach County, FL
San Diego, CA
Prince George's County, MD
Orange County, FL***
Duval County, FL
Montgomery County, MD
Memphis, TN
|
1,075,638
681,505
424,454
345,861
223,633
214,000
210,503
190,822
189,877
177,151
157,719
152,091
147,000
139,771
136,281
128,347
127,944
125,000
123,822
110,309
|
$7,902
5,991
6,968
5,143
5,621
5,822
5,592
4,485
3,740
8,059
N/A
5,076
7,493
5,947
6,063
6,370
5,809
4,989
7,740
4,533
|
1:16.8
1:22.1
1:20.8
1:19.6
1:23.7
1:19.4
1:19.1
1:23.7
1:17.3
1:22.5
1:16.9
1:15.8
1:14.4
1:17.8
1:19.9
1:17.7
1:16.0
1:17.5
1:17.0
1:17.7
|
|
Median
|
|
$5,815
|
1:17.8
|
* With the exception of Miami-Dade County, the cost per
pupil has been computed by Educational Research Service,
Inc. by dividing the total district's projected operating
expenditures (per adopted annual budget) by K-12 student
membership as of Fall 1997. For Miami-Dade County, the "Cost
Per Pupil" represents the actual expenditure per full-time
equivalent K-12 pupil.
** Does not represent typical class size. Ratio has been
computed by dividing student membership by total number of
classroom teachers.
*** 1996-97 data.
|
TOTAL PERSONNEL, 1998-99
(as of October 1998)
|
Classification
|
1998-99
|
|
Administrative Staff:
|
|
Officials, Administrators, Managers:
Instructional*
|
175
|
|
|
Officials, Administrators, Managers:
Non-Instructional*
|
179
|
|
|
Principals
|
325
|
|
|
Assistant Principals**
|
640
|
Instructional Staff:
|
|
Teachers:
|
Elementary
|
8,096
|
|
|
Secondary
|
5,805
|
|
|
Exceptional Student Ed.
|
2,906
|
|
|
Vocational/Adult and Others
|
1,359
|
|
|
(Total Teachers: 18,166)
|
|
|
|
Guidance
|
924
|
|
|
Visiting Teachers/Social Workers
|
116
|
|
|
Psychologists
|
180
|
|
|
Librarians & Audiovisual Staff
|
341
|
|
|
Other Professional Staff:
Instructional***
|
389
|
Support Staff:
|
|
Investigators, Patrol Officers
|
130
|
|
|
Other Professional and Technical
Staff****
|
592
|
|
|
Paraprofessionals (Teacher Aides)
|
2,232
|
|
|
Technicians
|
252
|
|
|
Clerical & Secretarial Staff
|
2,994
|
|
|
Service Workers
|
5,378
|
|
|
Skilled Crafts
|
1,108
|
|
|
Laborers, Unskilled
|
189
|
|
|
Total Full-time Staff
Total Part-time Staff
|
34,310
10,028
|
|
TOTAL Full-time & Part-time Staff
|
44,338
|
* Includes superintendent, deputy/associate/assistant
superintendents, directors, and supervisors.
** Includes 105 Adult and Community Education assistant
principals
*** Example: student activities/athletics directors,
placement specialists, teacher trainers, teachers on special
assignment, etc.
**** Example: evaluators, programmers, contracted
construction coordinators, lab technicians, safety
inspectors, etc.
Source:Public Schools Staff Survey (EEO-5), October 1998
ETHNIC CLASSIFICATION OF
FULL-TIME STAFF
(as of October 1998)
|
Job
Category
|
White
Non-Hispanic
|
Black
Non-Hispanic
|
Hispanic
|
Asian/American
Indian
|
|
Administrative
Instructional
Other Staff
|
|
475
36.0%
7,896
39.3%
2,268
17.6%
|
|
|
|
426
32.3%
5,315
26.4%
6,433
50.0%
|
|
|
|
409
31.0%
6,688
33.2%
4,098
31.8%
|
|
|
|
|
Total Full-time
Staff
|
|
|
|
|
|
TEACHERS' BASE SALARY
MINIMUMS & MAXIMUMS*
1998-99 SCHEDULE - 10 MONTHS
|
Bachelor's Degree
Master's Degree**
Specialist's Degree***
Doctor's Degree**
|
$28,650 - $52,500
$31,650 - $55,500
$33,550 - $57,500
$35,650 - $59,500
|
* Base salary does not include supplements, e.g., for
department chairpersons, additional pay for sixth period
teaching.
** Degree in teaching field.
*** Also those with 36 semester hours of graduate credit
in teaching field after receiving the master's degree.
|
Find out more about Miami-Dade County Public Schools
through the Internet at www.dadeschools.net
Additional information can be found in the following
statistical reports:
- District and School
Profiles describes some of the more
important characteristics of individual schools.
- Statistical
Abstract
provides statistical information on the status of
public education in Miami-Dade County including
multi-year data on students, staff, finances, etc.
|
MIAMI-DADE COUNTY PUBLIC
SCHOOLS
1450 Northeast Second Avenue
Miami, Florida 33132
THE SCHOOL BOARD
|
|
Dr. Solomon C. Stinson, Chair (District 2)
Dr. Michael M. Krop , Vice Chair(District 3)
Mr. G. Holmes Braddock (District 7)
Ms. Perla Tabares Hantman (District 4)
Dr. Robert B. Ingram (District 1)
Ms. Betsy H. Kaplan (District 9)
Mrs. Manty Sabatés Morse (District 6)
Mr. Demetrio Pérez, Jr., M.S. (District
5)
Dr. Marta Pérez (District 8)
Ms. Monica V. Hunt, Student Advisor
|
November 2002
November 2000
November 2000
November 2002
November 2000
November 2000
November 2002
November 2000
November 2002
|
|
|
|
SUPERINTENDENT OF
SCHOOLS
Mr. Roger C. Cuevas
MANAGEMENT AND
ACCOUNTABILITY
OFFICE OF EDUCATIONAL EVALUATION
AND MANAGEMENT ANALYSIS
(305) 995-7503
|