STATISTICAL HIGHLIGHTS
2000-01
M-DCPS Student
Membership
May 2001
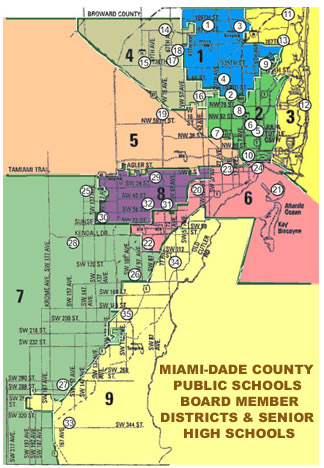
Miami-Dade County Public Schools is a countywide school
system, and it is the fourth largest system in the
nation.
Management of schools is totally independent of metropolitan
and city governments. The metropolitan government collects
the school tax for the school system, but exercises no
control over its use.
The nine-member School Board is elected by single member
districts. Regular, open meetings are generally held in the
Board auditorium each month on a Wednesday at one
o’clock.
Responsibility for administration of schools is vested in
the District Superintendent, appointed by the Board. The
school district is divided into six regions, each with a
region superintendent and administrative staff.
* Average teacher’s
salary excluding fringe benefits (Salary
for ten months).
1992-93
1993-94
1994-95
1995-96
1996-97
1997-98
1998-99
1999-00
2000-01
279
284
286
290
300
302
309
318
325
302,163
312,300
321,955
333,444
340,904
345,861
352,595
360,202
368,453
15,240
15,540
16,885
17,094
17,410
17,687
18,166
18,702
19,181
36,853
36,947
39,299
40,255
41,002
42,308
42,015
42,980
44,527
|
|
White Non- |
Black Non- |
Hispanic |
Other** |
Total |
|
|
|
731 |
4,095 |
4,422 |
184 |
9,432 |
|
|
|
2,703 |
7,551 |
14,490 |
661 |
25,405 |
|
|
|
2,901 |
8,142 |
15,836 |
685 |
27,564 |
|
|
|
2,990 |
8,383 |
15,901 |
668 |
27,942 |
|
|
|
3,053 |
8,750 |
16,269 |
667 |
28,739 |
|
|
|
3,054 |
8,879 |
16,423 |
681 |
29,037 |
|
|
|
3,235 |
8,645 |
16,919 |
556 |
29,355 |
|
|
|
3,224 |
9,239 |
16,677 |
533 |
29,673 |
|
|
|
3,285 |
9,037 |
16,404 |
463 |
29,189 |
|
|
|
3,215 |
8,592 |
15,952 |
468 |
28,227 |
|
|
|
3,970 |
11,459 |
19,735 |
470 |
35,624 |
|
|
|
3,183 |
8,256 |
14,281 |
422 |
26,142 |
|
|
|
3,135 |
7,435 |
12,781 |
448 |
23,799 |
|
|
|
2,601 |
5,818 |
9,539 |
357 |
18,315 |
|
|
TOTAL |
41,280 |
114,281 |
205,629 |
7,263 |
368,453 |
|
|
TOTAL MALE |
188,804 |
|||||
|
TOTAL FEMALE |
179,649 |
|||||
|
|
|
|||||
|
** |
Other includes American Indian,
Asian, and Multiracial categories. |
|||||
|
Source: |
Student Data Base System, October 2000 |
|||||
(OTHER THAN ENGLISH)
USED AS PRIMARY LANGUAGE BY STUDENTS
|
Language |
# Students Using |
Language |
# Students Using |
|||||
|
Spanish |
191,697 |
Urdu |
566 |
|||||
|
Haitian Creole |
22,839 |
Russian |
457 |
|||||
|
French |
2,319 |
Arabic |
428 |
|||||
|
Portuguese |
1,843 |
Tagalog |
197 |
|||||
|
Zhongwen |
803 |
Vietnamese |
195 |
|||||
BY BOARD MEMBER DISTRICT
OCTOBER 2000
|
District |
White Non- |
Black Non- |
Hispanic |
Other* |
Total |
|
Hispanic |
Hispanic |
||||
|
I |
855 |
34,506 |
7,641 |
527 |
43,546 |
|
II |
1,023 |
34,806 |
10,844 |
440 |
47,113 |
|
III |
6,026 |
7,282 |
11,213 |
848 |
25,369 |
|
IV |
2,661 |
4,808 |
40,596 |
536 |
48,601 |
|
V |
1,831 |
1,931 |
21,973 |
320 |
28,775 |
|
VI |
4,560 |
3,443 |
21,973 |
619 |
30,595 |
|
VII |
9,219 |
6,530 |
30,881 |
1,817 |
48,447 |
|
VIII |
4,123 |
1,074 |
32,999 |
565 |
38,761 |
|
IX |
9,848 |
14,552 |
18,695 |
1,416 |
44,511 |
|
Other** |
1,134 |
5,349 |
6,094 |
175 |
12,735 |
|
TOTAL |
41,280 |
114,281 |
205,629 |
7,263 |
368,453 |
|
PERCENT |
11.2% |
31.0% |
55.8% |
2.0% |
100% |
|
* |
Includes American Indian, Asian, and multiracial categories. |
|
** |
Includes vocational/technical education centers, charter schools, alternative/specialized centers, and the Educational Alternative Outreach Program centers. |
BY BOARD MEMBER DISTRICT*
2000-01
|
District |
|
|
|
|
|
||||
|
I |
|
|
|
|
|
||||
|
II |
|
|
|
|
|
||||
|
III |
|
|
|
|
|
||||
|
IV |
|
|
|
|
|
||||
|
V |
|
|
|
|
|
||||
|
VI |
|
|
|
|
|
||||
|
VII |
|
|
|
|
|
||||
|
VIII |
|
|
|
|
|
||||
|
IX |
|
|
|
|
|
||||
|
TOTAL |
|
|
|
|
|
||||
|
|
|||||||||
|
|||||||||
FIVE-YEAR TRENDS*
|
Year |
Elementary |
Middle |
Senior |
Total |
|
1996 |
71,891 |
33,034 |
40,472 |
145,397 |
|
1997 |
55,931 |
27,753 |
42,706 |
126,390 |
|
1998 |
52,110 |
27,736 |
44,979 |
124,825 |
|
1999 |
45,725 |
25,768 |
43,199 |
114,692 |
|
2000 |
58,577 |
30,224 |
45,359 |
134,160 |
|
* |
End of summer school count. |
|
Source: |
Division of Attendance |
|
Program |
Enrollment |
|
English for Speakers of Other Languages |
61,930 |
|
Spanish for Spanish Speakers |
106,719 |
|
Elementary Spanish as a Second Language |
47,661 |
|
Secondary Spanish as a Foreign Language |
15,504 |
|
Basic Skills in the Home Language |
49,206 |
|
Source: |
Computation by the Office of Educational Planning based on data in the Student Data Base System. |
|
Program |
|
Enrollment |
|||
|
Careers & Professions |
22 |
(Sr. High) |
7,495 |
||
|
Communication/Humanities |
4 |
(2 Elementary, 2 Middle) |
1,668 |
||
|
Gifted |
7 |
(Elementary) |
504 |
||
|
International Education |
12 |
(5 Elementary, 4 Middle, 3 Sr. High) |
7,615 |
||
|
Math/Science & Technology |
12 |
(4 Elementary, 6 Middle, 2 Sr. High) |
5,154 |
||
|
Montessori |
4 |
(Elementary) |
1,003 |
||
|
Visual & Performing Arts |
17 |
(5 Elementary, 7 Middle, 5 Sr. High) |
5,708 |
||
|
TOTAL |
78 |
29,147 |
|||
|
* |
In addition to magnet schools,
there are 14 “Controlled Choice” schools
serving 9,031 students; 13 Charter schools serving
3,309 students; and 4 Satellite Learning Centers
serving 515 students. |
|
|
Source: |
Division of Schools of Choice |
|
EDUCATION PROGRAMS, 2000-01*
|
Program |
Enrollment* |
|
Educable Mentally Handicapped |
2,932 |
|
Trainable Mentally Handicapped |
1,291 |
|
Physically Handicapped |
1,112 |
|
Speech/Language/Hearing Impaired |
5,355 |
|
Visually Handicapped |
146 |
|
Emotionally Handicapped |
3,656 |
|
Specific Learning Disabilities |
22,351 |
|
Gifted |
22,869 |
|
Hospital/Homebound |
221 |
|
Profoundly Handicapped |
3,967 |
|
TOTAL |
63,900 |
|
* |
Unduplicated membership “Survey 2” data as of February 2001. Total ESE enrollment, per Survey 9 collected in December was 62,308. |
|
|
Source: |
Department of Data Quality Management, compiled by Department of Research Services. |
|
|
Enrollment in Honors Courses, Dual Enrollment, & |
108,457 |
|
|
Advanced Placement Courses |
||
|
Percent of total 9-12 student periods |
17.4 |
|
|
|
||
|
Source: |
ISIS Course file, compiled by Department of Research Services. |
|
|
Total Enrollment - Grades 6-8 |
28,192 |
||
|
Exceptional Student Enrollment |
5,799 |
||
|
Enrollment in Grades 9-12: |
|||
|
Agribusiness |
924 |
||
|
Business Technology Education |
20,078 |
||
|
Diversified Education |
10,918 |
||
|
Health Science Occupations |
3,909 |
||
|
Family & Consumer Services |
9,643 |
||
|
Technology Education |
9,735 |
||
|
Industrial Education |
7,741 |
||
|
Marketing |
2,559 |
||
|
Public Service Education |
3,355 |
||
|
Total Enrollment in Grades 9-12 |
68,862 |
||
|
TOTAL ENROLLMENT |
102,853 |
||
|
Source: |
ISIS Course file, compiled by Department of Research Services. |
SCHOOL ENROLLMENT 2000-01
|
School/Center |
High School* |
Adult/ Voc.** |
|
Academy for Community
Education |
148 |
- |
|
TOTAL |
100,436 |
84,064 |
|
* |
October 2000 Membership |
||
|
** |
Unduplicated enrollment during
the first trimester. |
||
|
Sources: |
High School: Student Data Base System |
||
|
Adult Vocational: Office of Applied Technology, Adult, & Career Ed. |
|||
|
1995-96 |
1996-97 |
1997-98 |
1998-99 |
1999-00 |
|
|
High School* |
14,246 |
13,751 |
13,738 |
14,144 |
14,814 |
|
Adult School |
1,148 |
804 |
781 |
717 |
700 |
|
GED |
3,136 |
3,394 |
3,254 |
3,208 |
2,414 |
|
* |
Includes regular and exceptional student diplomas, but excludes Certificates of Completion |
|
|
Sources: |
High School: Student Data Base
System, October 2000 |
|
POSTSECONDARY INSTITUTIONS
|
Number |
Percent* |
|
|
Enrolled Community College |
3,468 |
32.9% |
|
Enrolled Public/PrivateUniversity |
3,212 |
30.5% |
|
Total Enrolled in College/University |
6,680 |
63.4% |
|
* |
Computed from 10,533 out of 14,144 graduates of FETPIP match data. |
SENIOR HIGH SCHOOLS*
|
|
||||||||||||||||||||||||||||||||||||||||||||||||||||||
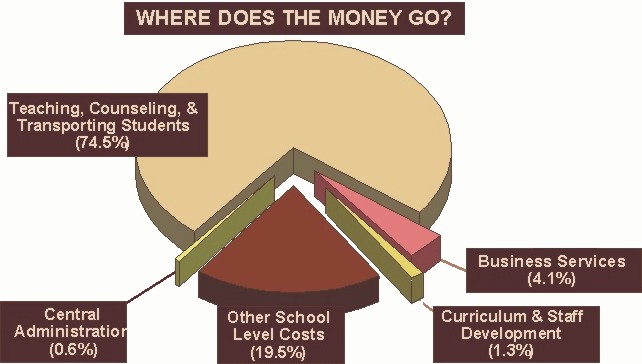
(in millions of dollars)
|
REVENUE |
||||||
|
Federal |
250.18 |
8.86% |
||||
|
State |
1,523.51 |
53.97 |
||||
|
Local |
1,049.27 |
37.17 |
||||
|
Total Revenue |
2,822.96 |
100.0% |
||||
|
Transfer from other Funds |
194.48 |
|||||
|
Non-Revenue Sources |
288.61 |
|||||
|
Beginning Balances/Encumbrances |
798.39 |
|||||
|
Total Revenues and Balances |
4,104.44 |
|||||
|
|
||||||
|
APPROPRIATIONS |
||||||
|
General Fund |
||||||
|
Instructional Services |
1,493.49 |
64.05% |
||||
|
Instructional Support |
195.23 |
8.37 |
||||
|
Board of Education |
5.55 |
.24 |
||||
|
General Administration |
8.26 |
.35 |
||||
|
School Administration |
136.99 |
5.87 |
||||
|
Facilities Acquisition & Construction |
.75 |
.03 |
||||
|
Fiscal Services |
14.91 |
.64 |
||||
|
Central Services |
80.56 |
3.45 |
||||
|
Transportation Services |
80.91 |
3.47 |
||||
|
Operation of Plant |
184.98 |
7.93 |
||||
|
Maintenance of Plant |
101.38 |
4.35 |
||||
|
Community Services |
29.24 |
1.25 |
||||
|
TOTAL |
2,332.25 |
100.0% |
||||
|
Special Revenue Funds |
||||||
|
(Instruction and Support Services $169.45; Food Services $114.92) |
284.37 |
|||||
|
Debt Service Fund |
||||||
|
(Redemption of Principal $99.37; Interest, Dues and Fees $76.47) |
175.84 |
|||||
|
Capital Project Funds |
||||||
|
(Land, Buildings, and Equipment $679.62; Remodeling $195.94; Others $84.94) |
960.50 |
|||||
|
Trust and Agency Funds |
||||||
|
(Early Retirement $3.00; Special Events $.71; Financial Aid $.98; Law Enforcement $.26; Student Activity $2.29) |
7.24 |
|||||
|
Total Appropriations |
3,760.20 |
|||||
|
Transfer from other Funds |
194.48 |
|||||
|
|
||||||
|
Ending Balance/Reserves |
||||||
|
General Fund $38.50; Food Service $7.86; Debt Service Fund $64.06; Capital Projects Funds $7.34; Early Retirement Fund $32.00) |
149.76 |
|||||
|
Total Appropriations & Balances |
4,104.44 |
|||||
|
|
||||||
|
Source: Office of Budget Management |
||||||
1996-97 TO 2000-01
(Operating Budget)
|
Year |
Taxable Property |
|
|
||
|
1996-97 |
$ 78,569,371,870 |
|
$ 549,058,485 |
||
|
1997-98 |
82,319,881,712 |
|
575,580,613 |
||
|
1998-99 |
87,104,369,411 |
|
594,304,403 |
||
|
1999-00 |
90,951,198,231 |
|
574,929,809 |
||
|
2000-01 |
97,829,364,698 |
|
622,869,782 |
||
|
|
|||||
|
|||||
|
|
|
|||||||
|
Year |
|
|
|
|
||||
|
1996-97 |
2.000 |
$ 149,281,807 |
1.010 |
$ 75,387,312 |
||||
|
1997-98 |
1.996 |
156,094,960 |
1.106 |
86,493,500 |
||||
|
1998-99 |
2.000 |
165,498,302 |
0.978 |
80,928,670 |
||||
|
1999-00 |
2.000 |
172,807,277 |
0.990 |
85,539,602 |
||||
|
2000-01 |
2.000 |
185,875,793 |
0.915 |
85,038,175 |
||||
|
|
||||||||
|
Source: Office of Budget Management |
||||||||
(Twenty Largest U.S. School Districts)
1999-00
|
District |
K-12 Membership* |
Cost Per |
Teacher/Pupil Ratio** |
|||
|
New York, NY |
1,094,852 |
$ 9,202 |
1:14.0 |
|||
|
Los Angeles, CA |
711,187 |
7,795 |
1:20.5 |
|||
|
Chicago, IL |
431,750 |
7,325 |
1:16.5 |
|||
|
MIAMI-DADE COUNTY, FL |
360,202 |
5,419 |
1:19.8 |
|||
|
Broward County, FL |
235,920 |
4,705 |
1:18.5 |
|||
|
Clark County, NV |
217,139 |
4,740 |
1:23.2 |
|||
|
Houston, TX |
210,000 |
7,859 |
1:17.0 |
|||
|
Philadelphia, PA |
205,413 |
N/A |
1:21.5 |
|||
|
Hawaii, State of |
185,036 |
5,252 |
1:16.9 |
|||
|
Detroit, MI*** |
179,103 |
6,279 |
1:19.4 |
|||
|
Dallas, TX |
159,990 |
6,774 |
1:16.7 |
|||
|
Hillsborough County, FL |
159,456 |
7,580 |
1:21.0 |
|||
|
Fairfax County, VA |
154,368 |
7,742 |
1:13.7 |
|||
|
Palm Beach County, FL |
149,757 |
6,018 |
1:15.9 |
|||
|
San Diego, CA*** |
136,281 |
6,063 |
1:19.9 |
|||
|
Orange County, FL |
140,000 |
5,570 |
1:21.3 |
|||
|
Prince George’s County, MD |
130,950 |
6,842 |
1:16.7 |
|||
|
Montgomery County, MD |
130,689 |
8,491 |
1:15.6 |
|||
|
Duval County, FL |
123,698 |
5,313 |
1:17.9 |
|||
|
Memphis, TN |
116,708 |
5,409 |
1:17.8 |
|||
|
Median |
$6,279 |
1:17.9 |
||||
|
* |
With the exception of Miami-Dade County, the cost per pupil has been computed by Educational Research Service, Inc. by dividing the total district’s projected operating expenditures (per adopted annual budget) by K-12 student membership as of Fall 1998. For Miami-Dade County, the “Cost Per Pupil” represents the actual expenditure per full-time equivalent K-12 pupil as calculated by the Office of the Comptroller. |
|
|
** |
Does not represent actual or typical class size. Ratio has been computed by dividing student membership by total number of classroom teachers. |
|
|
*** |
1998-99 data. |
|
|
|
||
|
Source: |
Educational Research Service, Inc |
|
(as of October 2000)
|
Classification |
|||
|
Administrative Staff: |
|||
|
Officials, Administrators, Managers: Instructional* |
183 |
||
|
Officials, Administrators, Managers: Non-Instructional* |
202 |
||
|
Principals |
330 |
||
|
Assistant Principals** |
678 |
||
|
Instructional Staff: |
|||
|
Teachers: |
Elementary |
8,611 |
|
|
Secondary |
6,123 |
||
|
Exceptional Student Ed. |
3,251 |
||
|
Vocational/Adult and Others |
1,196 |
||
|
(Total Teachers: 19,181) |
|||
|
Guidance |
1,028 |
||
|
Visiting Teachers/Social Workers |
127 |
||
|
Psychologists |
192 |
||
|
Librarians & Audiovisual Staff |
350 |
||
|
Other Professional Staff: Instructional*** |
521 |
||
|
Support Staff: |
|||
|
Investigators, Patrol Officers |
161 |
||
|
Other Professional and Technical Staff**** |
635 |
||
|
Paraprofessionals (Teacher Aides) |
2,417 |
||
|
Technicians |
349 |
||
|
Clerical & Secretarial Staff |
3,147 |
||
|
Service Workers |
5,798 |
||
|
Skilled Crafts |
1,113 |
||
|
Laborers, Unskilled |
185 |
||
|
Total Full-time Staff |
36,597 |
||
|
Total Part-time Staff |
10,828 |
||
|
TOTAL Full-time & Part-time Staff |
47,425 |
||
|
* |
Includes superintendent, deputy/associate/assistant superintendents, directors, and supervisors. |
|
|
** |
Includes 91 Adult and Community Education assistant principals |
|
|
*** |
Example: student activities/athletics directors, placement specialists, teacher trainers, teachers on special assignment, etc. |
|
|
**** |
Example: evaluators,
programmers, contracted construction coordinators,
lab technicians, safety inspectors, etc. |
|
|
Source: |
Public Schools Staff Survey (EEO-5), October 2000 |
|
(as of October 2000)
|
Job Category |
|
|
|
|
|||||
|
|
|
|
|||||||
|
Administrative |
479 |
439 |
467 |
8 |
|||||
|
34.4% |
|
31.5% |
33.5% |
0.6% |
|||||
|
Instructional |
7,617 |
5,613 |
7,857 |
312 |
|||||
|
35.6% |
26.2% |
36.7% |
1.5% |
||||||
|
Other Staff |
2,155 |
6,834 |
4,720 |
96 |
|||||
|
15.6% |
49.5% |
34.2% |
0.7% |
||||||
|
Total Full-time Staff |
10,251 |
12,886 |
13,044 |
416 |
|||||
|
28.0% |
35.2% |
35.6% |
1.1% |
||||||
2000-01 SCHEDULE - 10 M0NTHS
|
Bachelor’s Degree |
$32,275 - $56,275 |
|
Master’s Degree** |
$35,275 - $59,275 |
|
Specialist’s Degree*** |
$37,275 - $61,275 |
|
Doctor’s Degree** |
$39,275 - $63,275 |
|
* |
Base salary does not include supplements, e.g., for department chairpersons, additional pay for sixth period teaching. |
|
** |
Degree in teaching field. |
|
*** |
Thirty-six semester hours of graduate credit in teaching field after receiving the master’s degree. |
|
Find out more about Miami-Dade County Public
Schools through |

|
NOTE: |
Additional information can be found in the
following statistical reports: |
||||||
|
• |
District and School Profiles includes individual school statistics on staff and student characteristics, information on educational programs, and a summary of student achievement. |
||||||
|
• |
Statistical Abstract provides statistical information on the status of public education in Miami-Dade County including multi-year data on students, staff, finances, etc. |
||||||
|
• |
New Directions describes some of the more important program features and district characteristics. |
||||||
|
1450 Northeast Second Avenue Miami, Florida 33132 |
|||
|
|
|
|
|
|
|
|
|
Ms. Perla Tabares Hantman, Chair (District 4) |
November 2002 |
|
Dr. Michael M. Krop, Vice Chair
(District 3) |
November 2004 |
|
Dr. Robert B. Ingram (District 1) |
November 2004 |
|
Ms. Betsy H. Kaplan (District 9) |
November 2004 |
|
Mrs. Manty Sabatés Morse (District 6) |
November 2002 |
|
Ms. Jacqueline V. Pepper (District 7) |
November 2004 |
|
Mr. Demetrio Pérez, Jr., M.S. (District 5) |
November 2004 |
|
Dr. Marta Pérez (District 8) |
November 2002 |
|
Dr. Solomon C. Stinson (District 2) |
November 2002 |
|
Ms. Marylynne K. Hunt-Dorta, Student Advisor |
|
|
SUPERINTENDENT OF SCHOOLS |
|
Mr. Roger C. Cuevas |
|
|
|
MANAGEMENT AND ACCOUNTABILITY |
|
(305) 995-7503 |